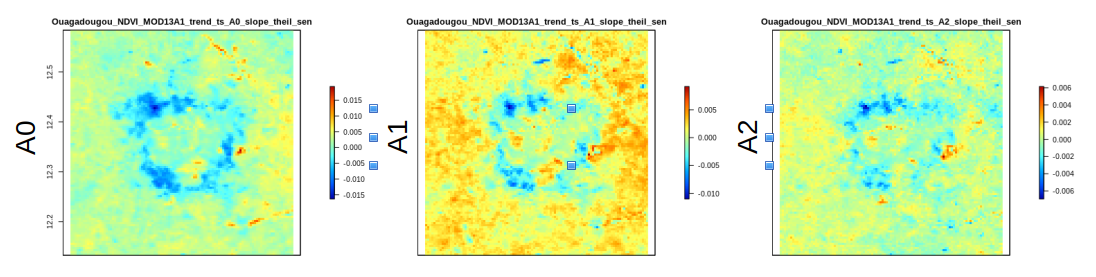
We mapped environmental changes using Seasonal Trend Analysis using windowed Fourier parameters (A0: Amplitude 0, A1: Amplitude 1 and A2L amplitude) in annual windows. Figure 1 displays the slope of change for the three parameters using NDVI over the 2001-2016 time period. Apparent is a blude ring around Ouagadogou at the interface between urban and rural areas. This indicates trends in the areas with decrease in average NDVI (A0), average seasonality (A1) and changes in the seasonal patterns (A2).