
In REACT, we developed machine learning-based models to map the spatial distribution of malaria risk at an intra- and inter-urban fashion in several sub-Saharan African cities.
Intra-urban very-high-resolution malaria models
Harnessing the power of very-high-resolution satellite information, malaria prevalence was mapped and a very fine scale, while clear associations between land-use and land-cover elements were unveiled. In Figure 1, spatial positive hotspots of malaria prevalence can be found in agricultural and informal settlements of Kampala. Notably, planned residential areas are estimated to have much lower risk.
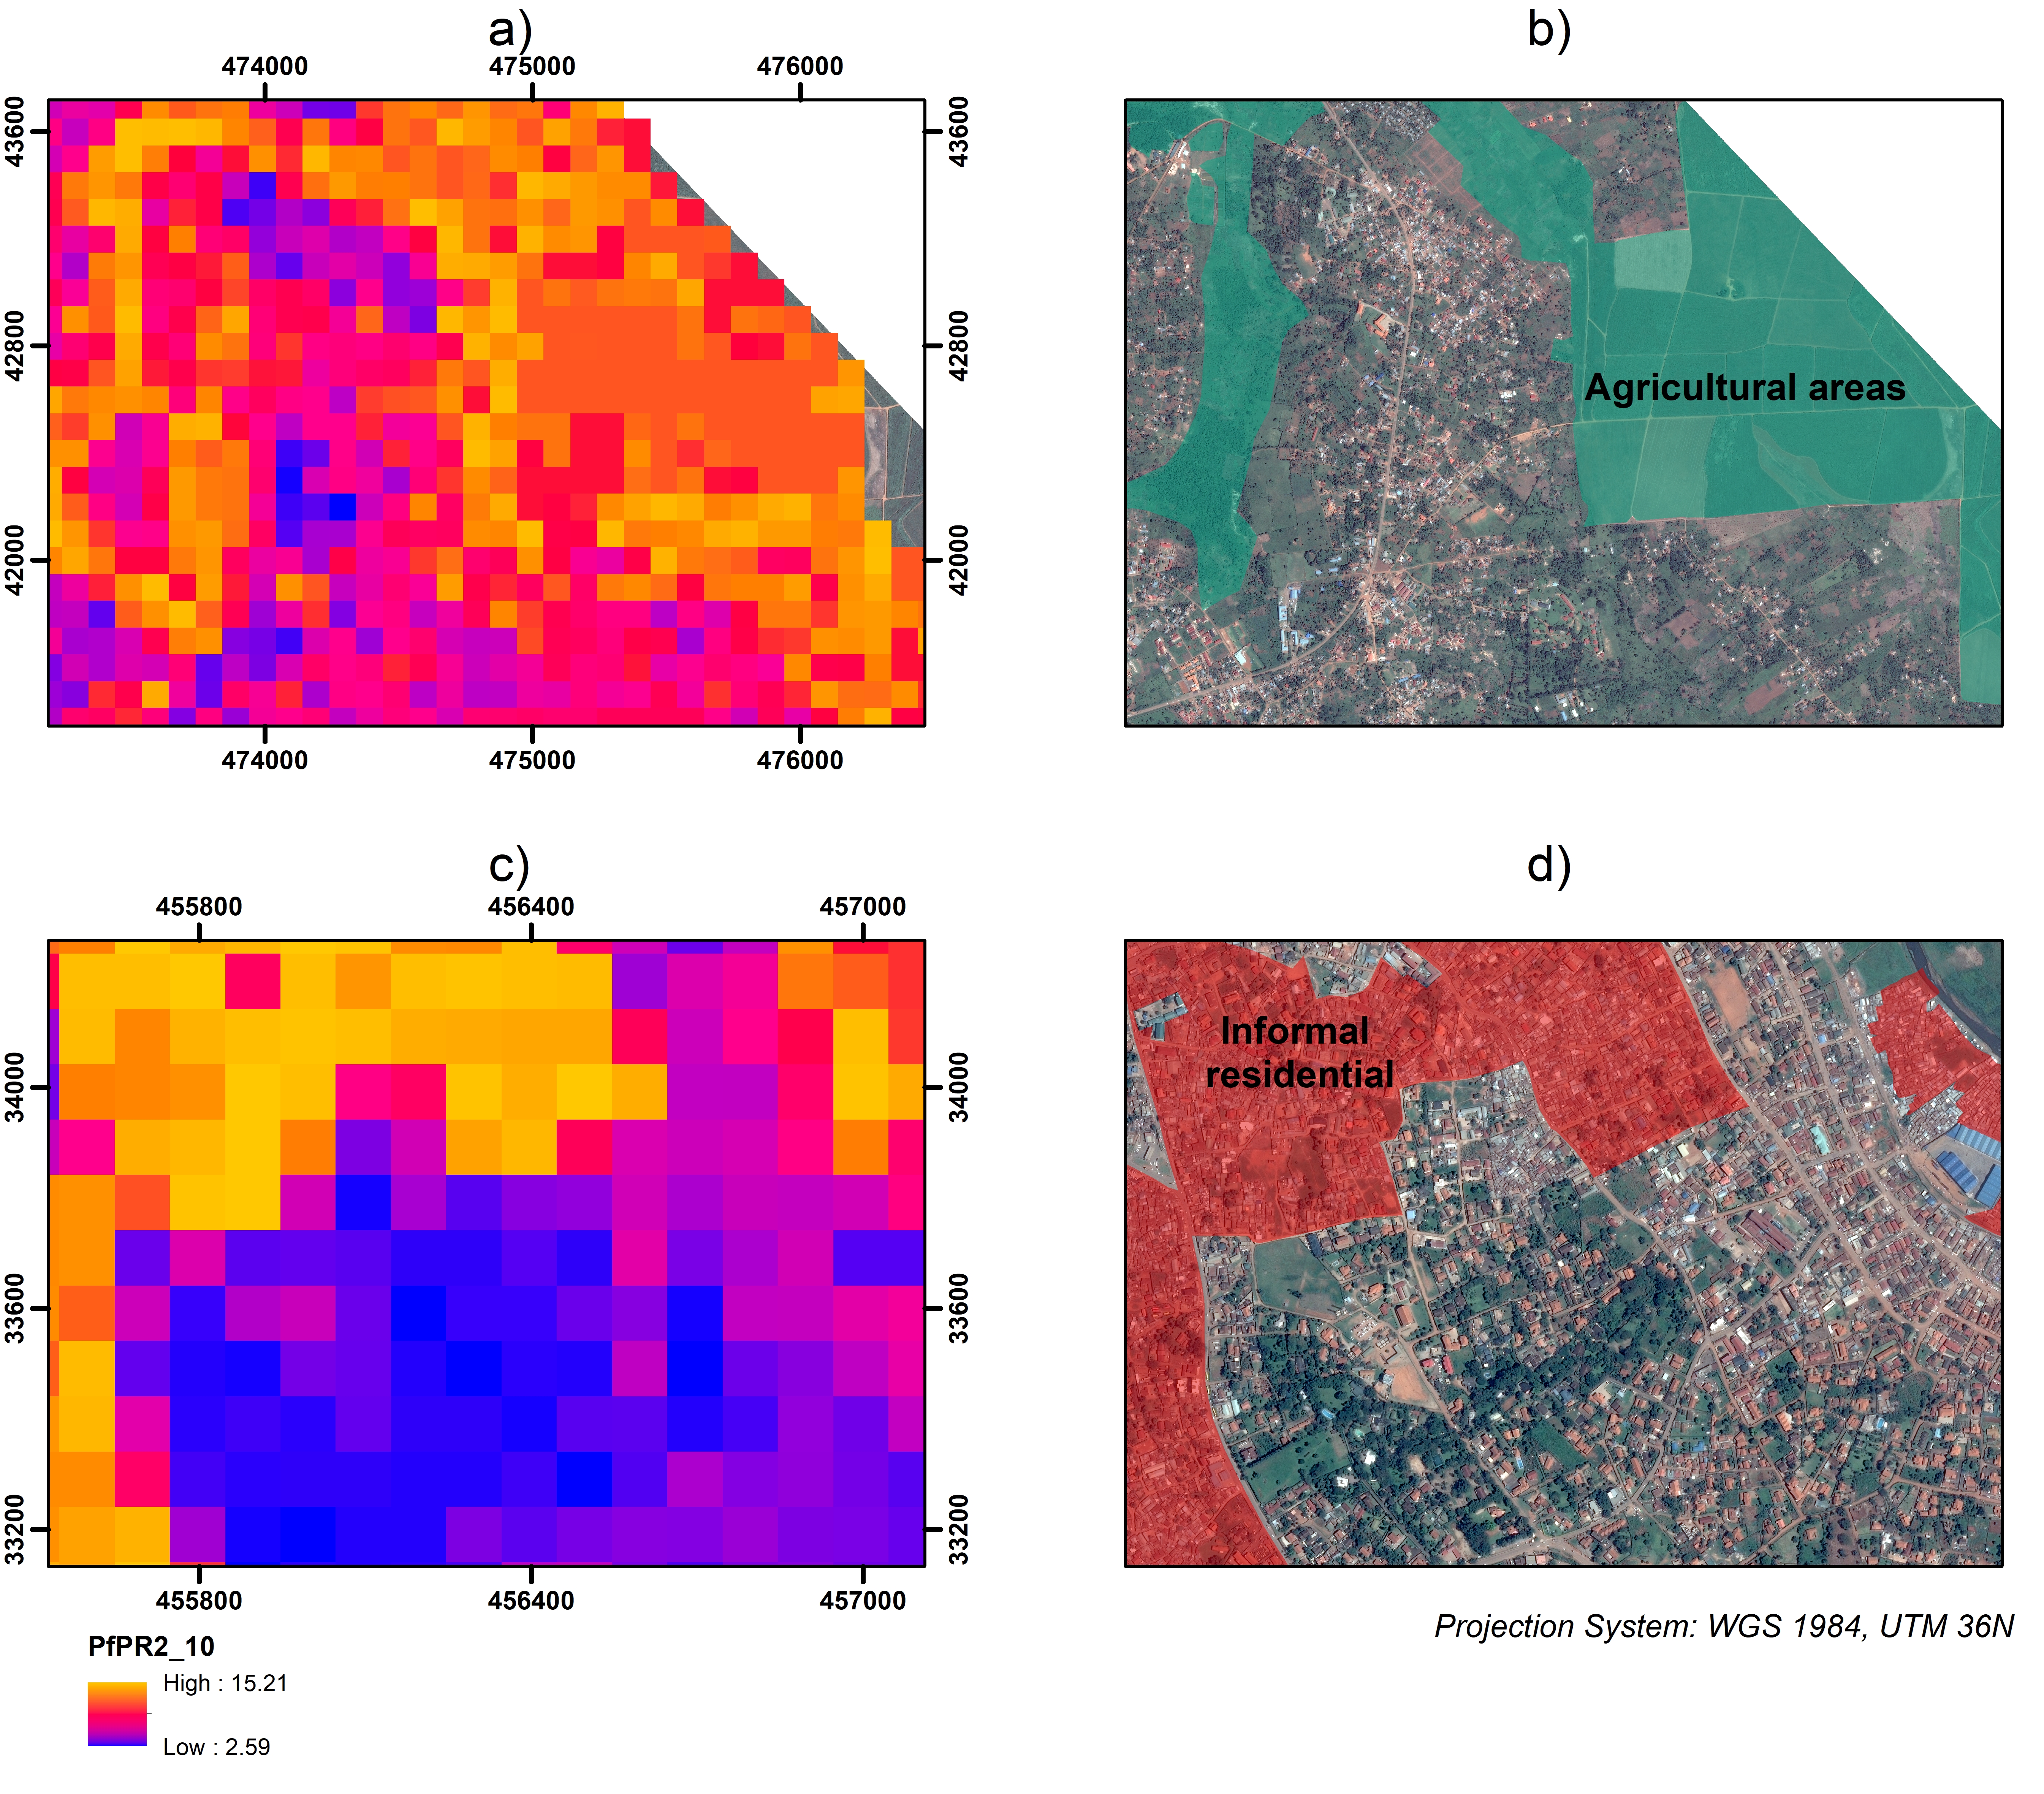
Figure 1. malaria prevalence estimates at a 100 meter resolution in Kampala, Uganda. a,b) in peri-urban agricultural areas and c,d) in informal and formal settlements [1].
Similar results are shown for Dar es Salaam, Tanzania (Figure 2). The highly dense slums and agricultural areas of Dar es Salaam appear to be positively associated with increased malaria prevalence. Our mapped products indicate these spatial variations at a very fine scale, allowing for an enhanced understanding of urban malaria at city-wide extents. Our maps can be downloaded at the "Data availability" section of the site.
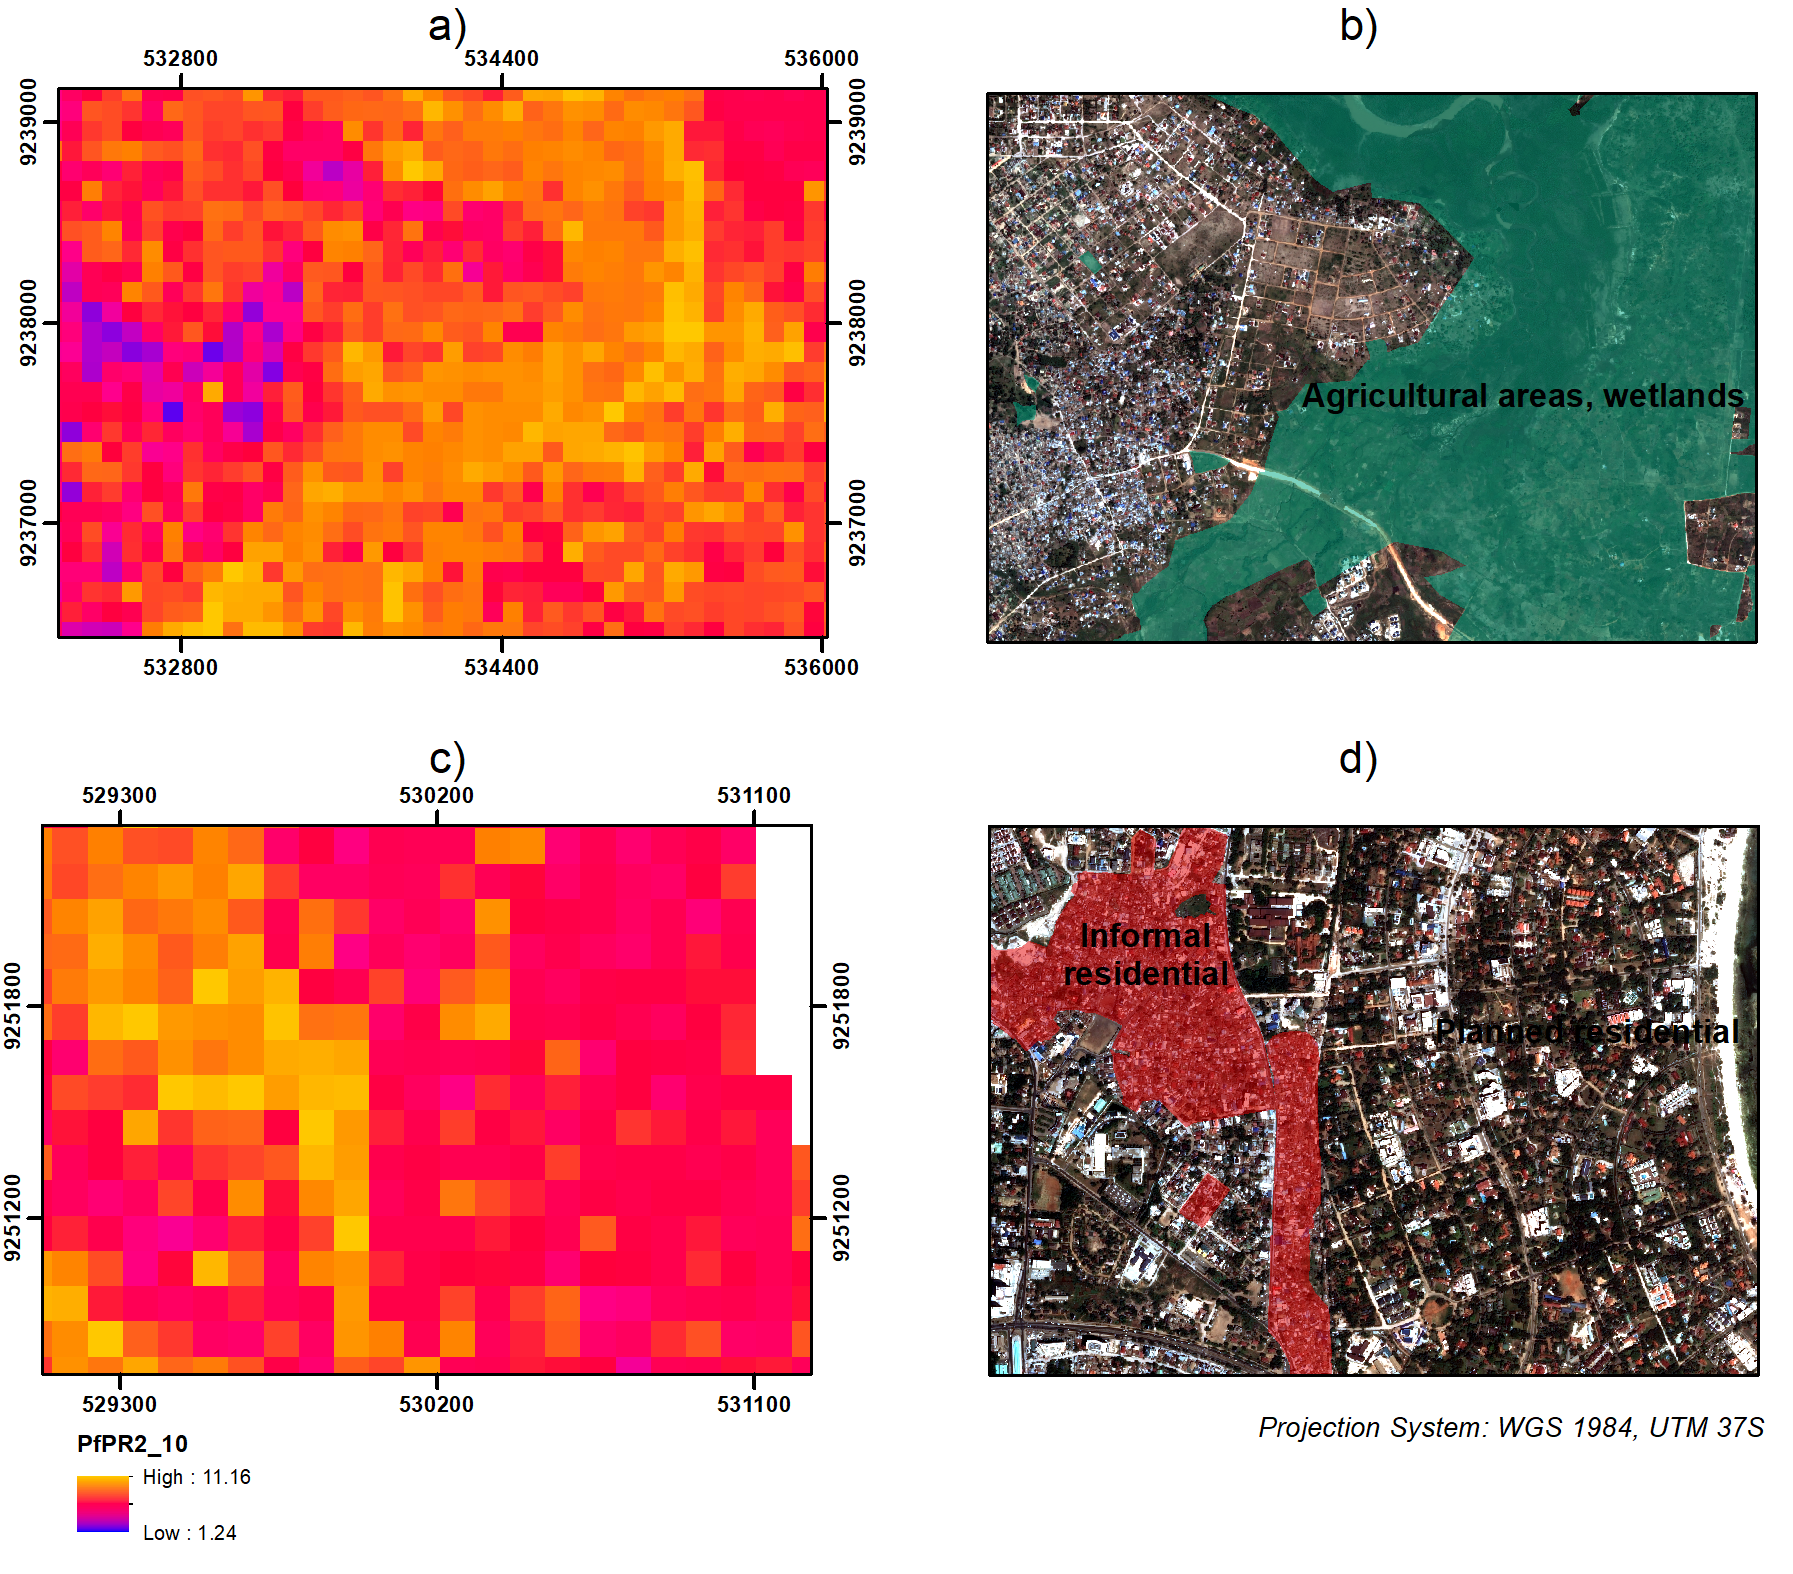
Figure 2. Malaria prevalence estimates at a 100 meter resolution in Dar es Salaam, Tanzania. a,b) in peri-urban agricultural areas and c,d) in informal and formal settlements [1].
Inter-urban high-resolution malaria models
The REACT project was first to use the land use land cover classification of the Local Climate Zones to predict and compare in standard way malaria prevalence across 9 Sub-Saharan African cities [2]. Results showed that places located close to wetlands and in more vegetated areas are more prone to catch malaria. In dense urban settlements, prevalence was found to be higher in informal settlements. In general, the prevalence was similar across all cities in the densely built areas. Yet the urban to rural gradient was different from one city to another. Suburban and rural areas in dry climates (e.g., Dakar) were at much lower risk than cities in rain tropical forests (e.g., Kinshasa).
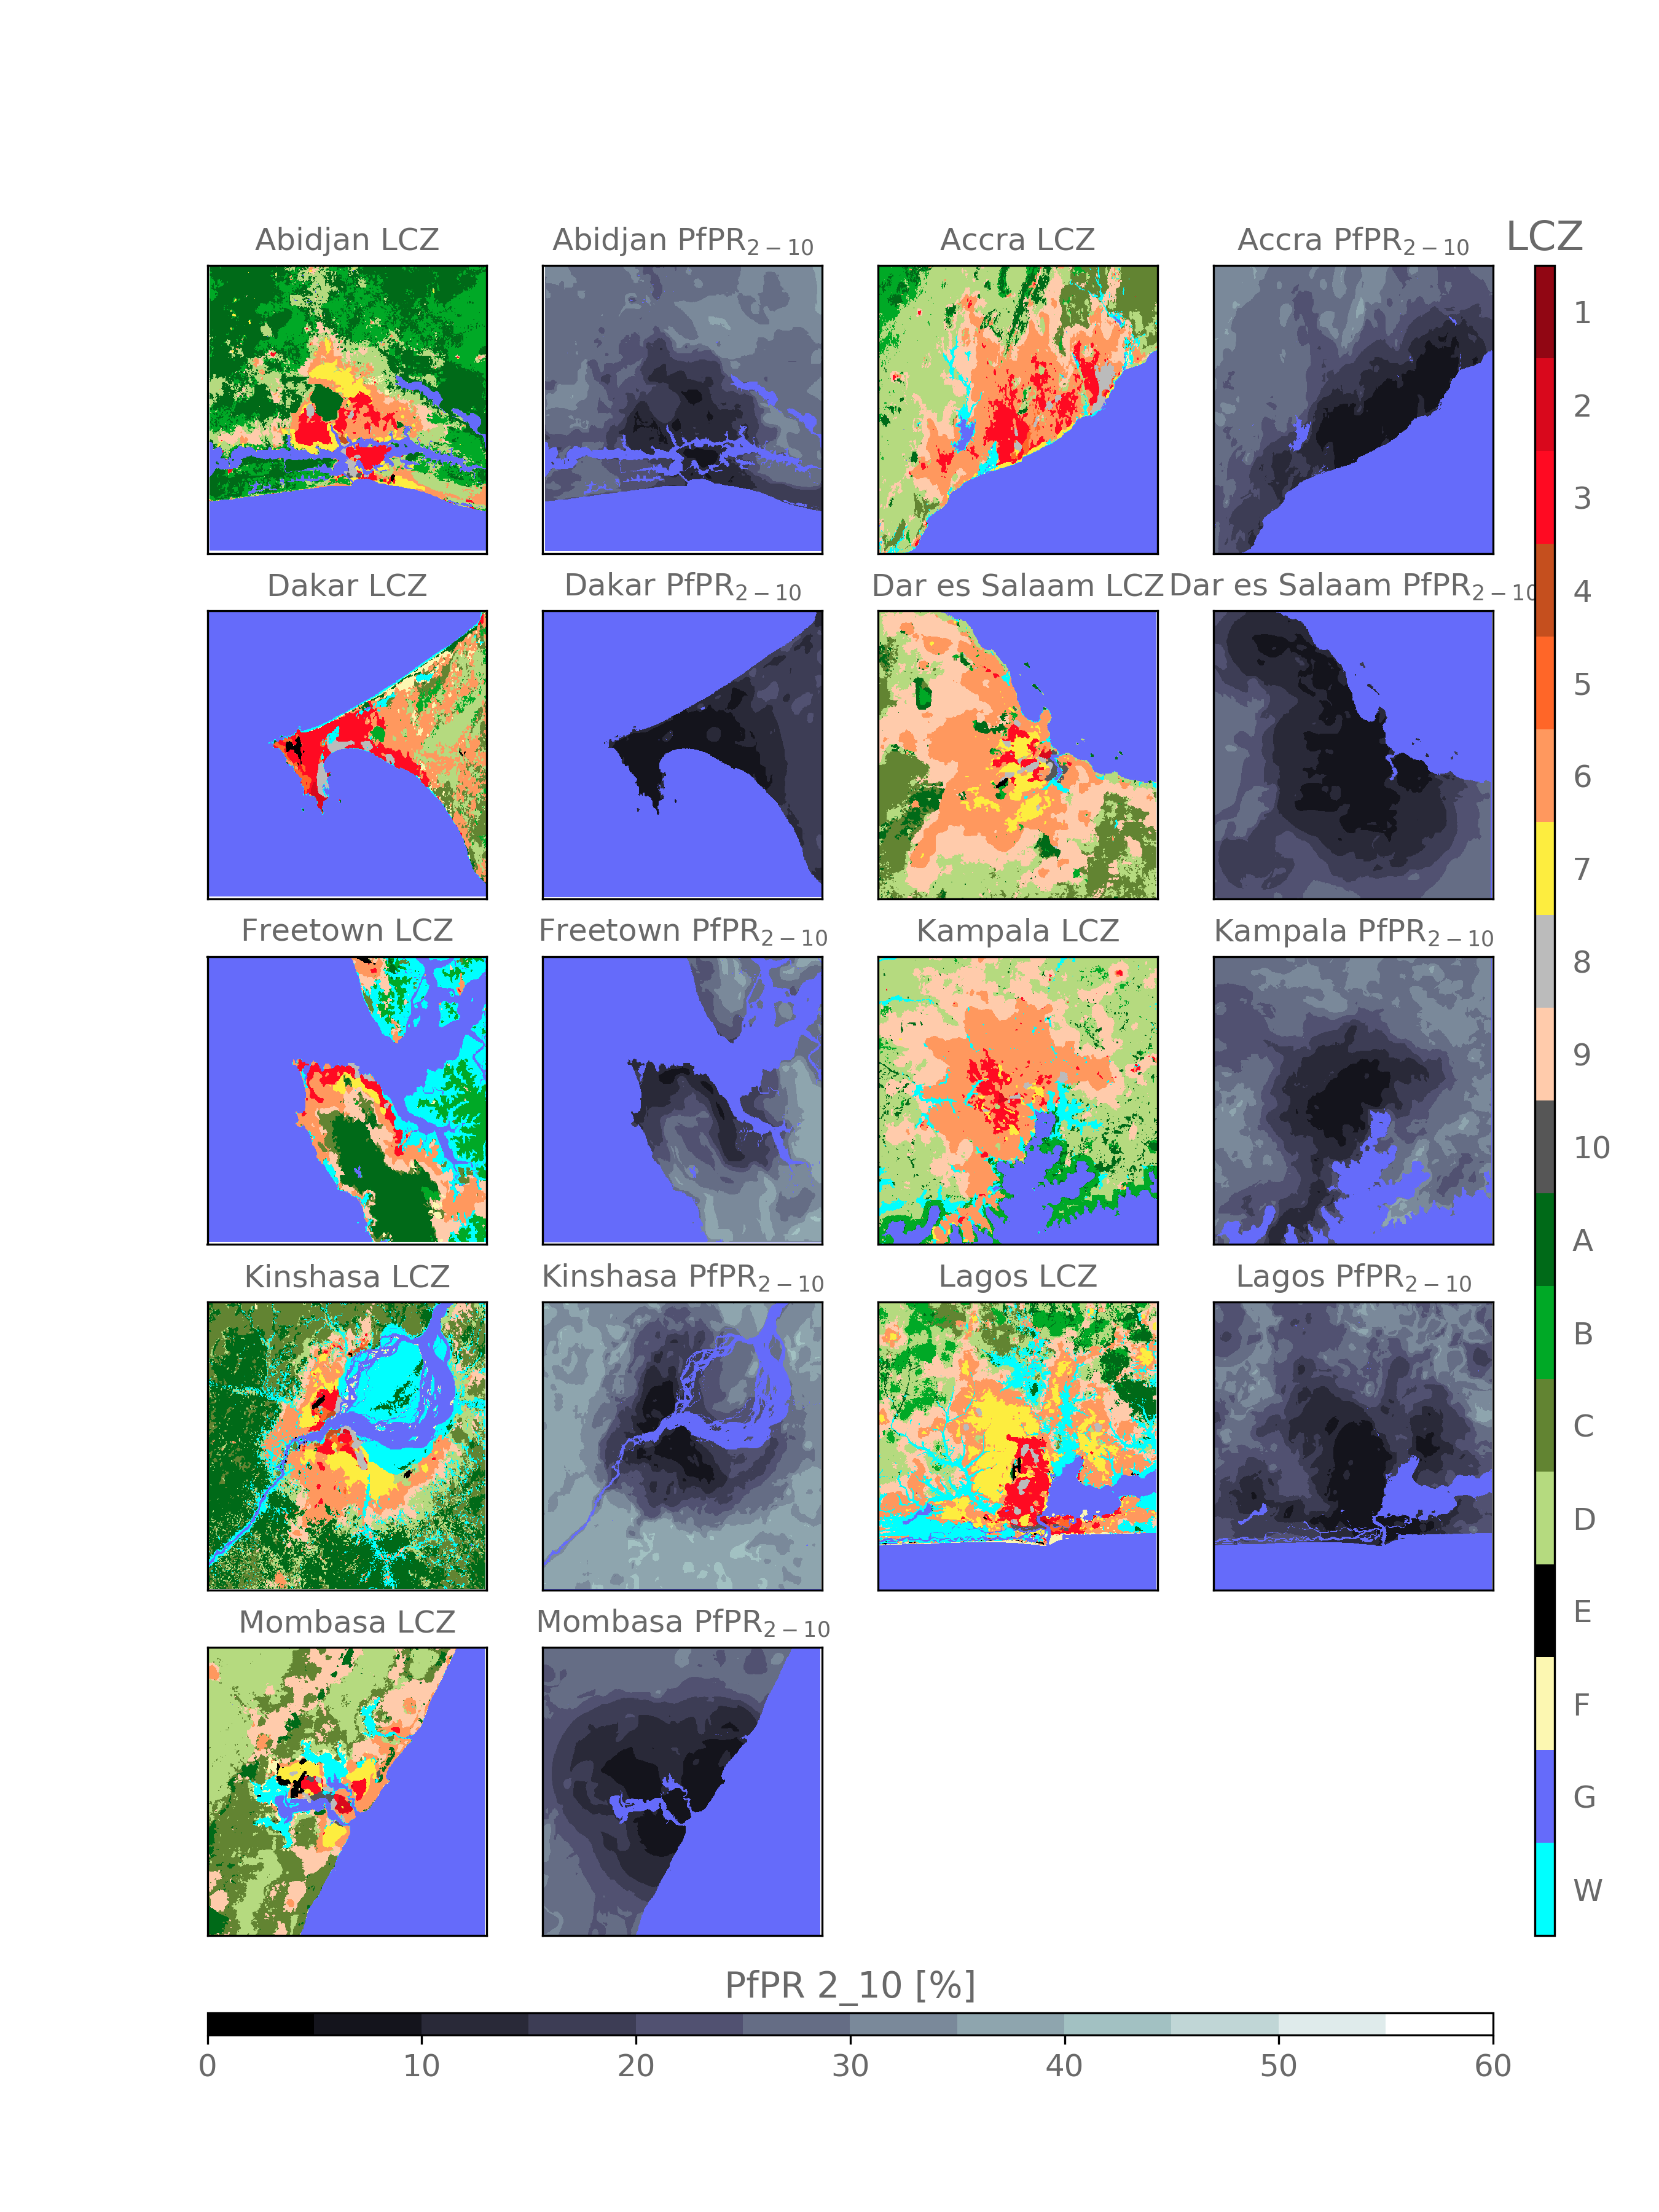
Figure 3. Local climate zones maps at 100 m horizontal resolution (LCZ) and the predicted malaria prevalence in percentage at 1 km resolution (plasmodium falciparum prevalence in children from age 2 to 10; PfPR 2_10) for 9 Sub-Saharan African cities.
References
[1] Georganos, Stefanos, et al. "Modelling and mapping the intra-urban spatial distribution of Plasmodium falciparum parasite rate using very-high-resolution satellite derived indicators." International journal of health geographics 19.1 (2020): 1-18.
[2] Brousse, Oscar, et al. "Can we use local climate zones for predicting malaria prevalence across sub-Saharan African cities?." Environmental Research Letters 15.12 (2020): 124051.