
The REACT project was helped by the newly developed Google’s Earth Engine which centralized and eased the data acquisition of high-resolution satellite images. Multiple potential spatial covariates of inter- and intra-urban malaria epidemiology were gathered for 24 cities of interests (e.g, NDVI, Elevation, NDWI...). Besides, a major achievement was done which consisted in the mapping of 9 cities of interest in the form of Local Climate Zones, a newly developed standardized land-use land-cover classification made of 17 classes (10 urban and 7 natural) that represents universal urban environments where different urban climates are to be expected. Intrinsically, they also inherit some socio-economic and biogeographical dimensions which further justified their use for modelling urban malaria epidemiology. The REACT project was amongst the main contributors to the World Urban Database and Access Portal Tool (WUDAPT) for developing the mapping framework of Sub-Saharan African cities. Among other things, using Sentinel 1 backscatter, the Normalized Difference Urban Index and Sentinel 2 red edge bands to improve the mapping accuracy was proposed during the REACT project.

Figure 1: Nine Sub-Saharan African cities mapped during the REACT project in the form of Local Climate Zones (LCZ)
The REACT project was also the opportunity to explore the potential application of regional climate models at scales where urban schemes can be activated to represent the effect of urban areas on the local climate. The first urban climate simulation done in Sub-Saharan Africa using the TERRA_URB urban scheme embedded in the COSMO-CLM regional climate model was achieved over Kampala in Uganda. This, thanks to the urban parameters offered by the Local Climate Zone map developed in the WP4. The impact of the recent and rapid urbanization (from year 2000 to 2017) is expected to have contributed to a significant increase in the urban heat island intensity of up to 2°C and a drying of the urban environment. The urban area is also expected to change the local land-lake circulations.

Figure 2: Impact of recent urbanization on the local climate in the greater Kampala urban area (black line) on air temperature at 2 m (left) and specific humidity (right). Wind speed and direction anomalies are represented by the black arrows. Lake shores are in turquoise. Green dots indicate statistically significant changes.
This achievement was thought to be improved by more detailed urban parameters than the generic ones derived through the Local Climate Zones. Therefore, a field-campaign held during the summer 2018 was organized. During the campaign, information on the building materials and the urban canyon morphologies was gathered. The latter were then implemented in the urban climate model to test its sensitivity to those. It was demonstrated that more city-specific parameters could contribute to the improvement of the TERRA_URB performance in terms of land surface temperature in particular, but also to a lesser extent to air temperature.
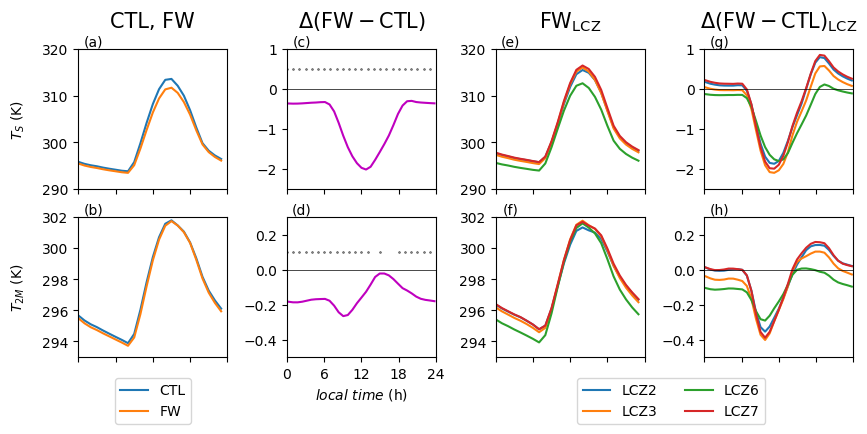
Figure 3: On the left side, diurnal cycles of modelled surface temperature (TS) and air temperature at 2 m (T2M) and their differences between the control run with generic LCZ parameters and more city-specific parameters gathered during the field campaign (FW). Significant changes are highlighted by grey dots. On the right side, similar diurnal cycles but per Local Climate Zones (LCZ) for the FW simulation and the differences with the ones from the CTL run
A semi-climatological run of a 5-years period (2011-2015) was done over Kampala using the generic parameters from the Local Climate Zones and served the modelling of the Temperature Suitability Index further used for intra-urban malaria modelling (WP 9). A similar strategy, but only for the dry period of 2014 was adopted over Dar es Salaam in Tanzania.